Larger constructed example (provided by James Moody)
The next constructed network was provided by James Moody (moody.zip). Network has 100130 vertices and 299644 lines. Line values are integers 1, 2, 3, and 4. Network is constructed by randomly connecting 2000 clusters each about ~50 vertices, but some variance (the true partition is available in ZIP file as well).Resolution parameter r=1
For resolution parameter=1 using Louvain method in each call we get quite different partitions with Q around 0.867 and number of clusters around 370. To check how much these these partitions differ from each other we use Partitions/Info/Cramer's V, Rajski, Adjusted Rand Index. We get Cramers's V around 0.63 and ARI around 0.38.Similar different results are obtained when applying VOS Clustering (VOSQ around 0.856, number of clusters 250, Cramer's V around 0.67 and ARI around 0.43).
It seems that resolution parameter r=1 does not reveal the real clusters in this network.
Selecting larger resolution parameters r=40 and r=130
Therefore we must experiment with different values of resolution parameter, to get higher/lower number of clusters. After some tries we find out that using r=40 for Louvain method, and r=130 for VOS Clustering, we can reproduce the known partition into 2000 clusters very well.Louvain method r=40
For Louvain method (r=40) all correlation measures between the obtained partition and known true partition (moody_commun.clu) are very high:
Cramers V: 0.99638559
Rajski(C1 <-> C2): 0.99543460
Rajski(C1 -> C2): 0.99767066
Rajski(C1 <- C2): 0.99775350
Adjusted Rand Index: 0.99299169
It is interesting that partition obtained using Louvain method has even larger modularity Q(r=40)=0.84276
than the known true partition Q(r=40)=0.84272. James Moody gave the following explanation why this happens:
"Since, by random chance, some vertices might send 'too many' ties to the wrong cluster and be better placed in an adjacent cluster."
VOS Clustering r=130
Similar observations are true if we compare partitions obtained using VOS Clustering (r=130) and known true partition (moody_commun.clu). In this case correlations are:
Cramers V: 0.98687252
Rajski(C1 <-> C2): 0.98436821
Rajski(C1 -> C2): 0.99211844
Rajski(C1 <- C2): 0.99212663
Adjusted Rand Index: 0.97333510
Again the partition obtained using VOS Clustering has even larger VOSQ(r=130)=0.78191 than the true partition VOSQ(r=130)=0.78118.
Comparing partitions obtained using Louvain method (r=40) and VOS Clustering (r=130)
Correlations among partitions obtained using Louvain method and VOS Clustering are very high (significant):
Cramers V: 0.98754929
Rajski(C1 <-> C2): 0.98523995
Rajski(C1 -> C2): 0.99261041
Rajski(C1 <- C2): 0.99251980
Adjusted Rand Index: 0.97486585
Visualization of partitions obtained by Louvain method and VOS Clustering
Finally lets draw the picture of the network with communities drawn in different colors.We can use one of the Pivot MDS algorithms available in Layout/Pivot MDS with random pivots (or we can take community representatives as pivots). After obtaining the layout we use Options/Transform/Resize Cluster Area (0.1), to get vertices that belong to the same cluster closer together.
Carefully examining both layouts we can find some differences. But do not compare colors of clusters, since they can be different - cannonical partitions are used, so that vertex 1 is always in cluster 1. Compare just the shape of clusters and eventually missing vertices in some clusters.
| Best partition according to Louvain method, Q(r=40)=0.842763, 2000 clusters |
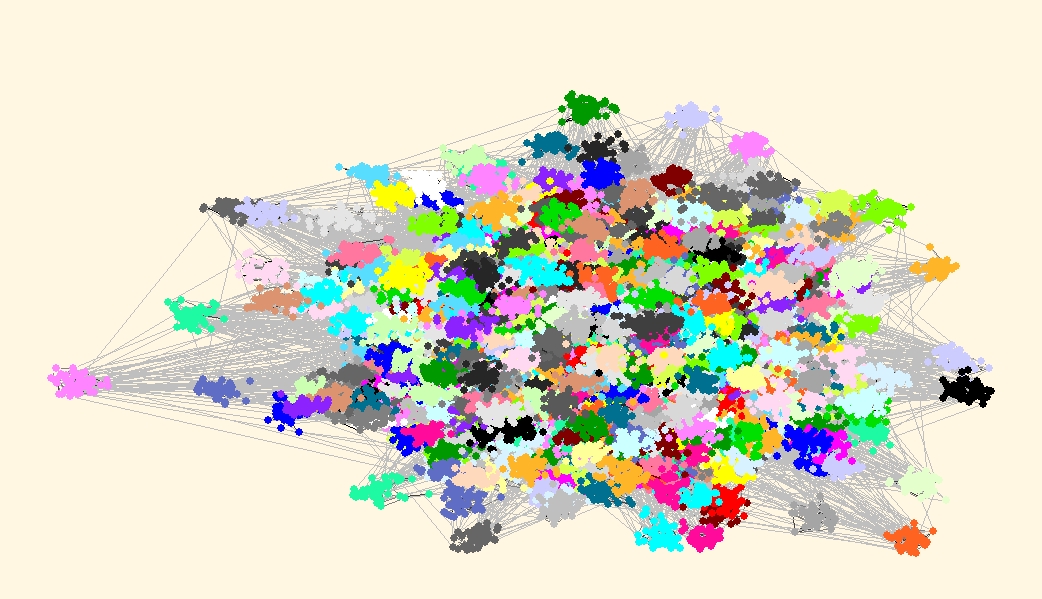 |
| Best partition according to VOS Clustering, VOSQ(r=130)=0.781911, 2000 clusters |
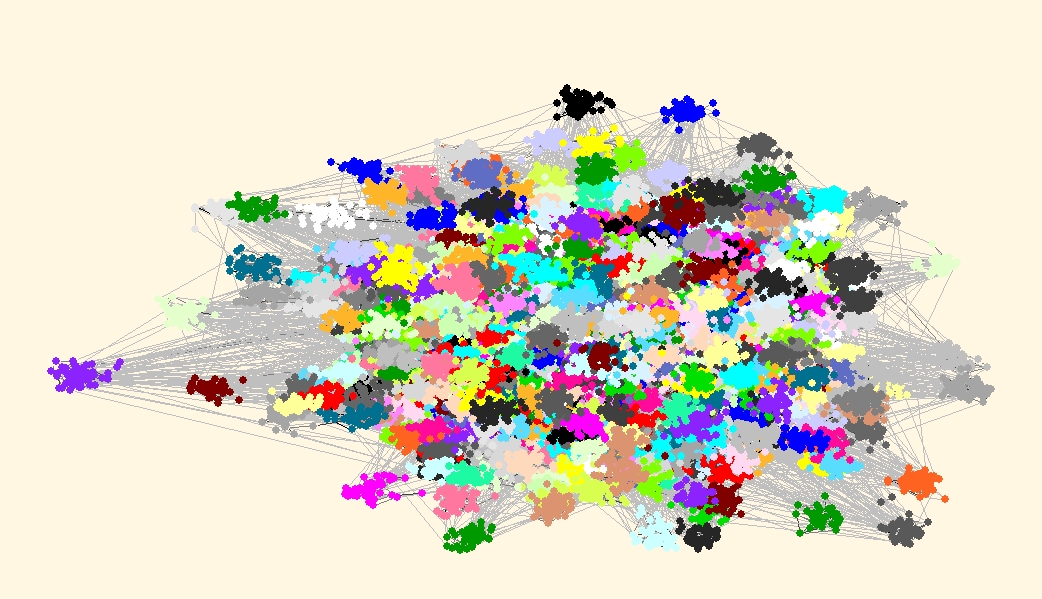 |
Comparing Louvain method and VOS Clustering Back to Pajek and Pajek-XXL Main page.